Economic data, made usable.
We turn scattered, dirty, unstructured economic data into information you can query and interpret. With AI and economist judgment.
Discuss your dataOur capabilities
Structure
We organize scattered, unstructured data to turn it into usable information.
Query
We make information queryable so you can answer questions about your data.
Interpret
We combine AI and economist judgment to give information context and meaning.
A clear path to usable data
We work with data that already exists but cannot yet be put to use.
Sources
Process
Information
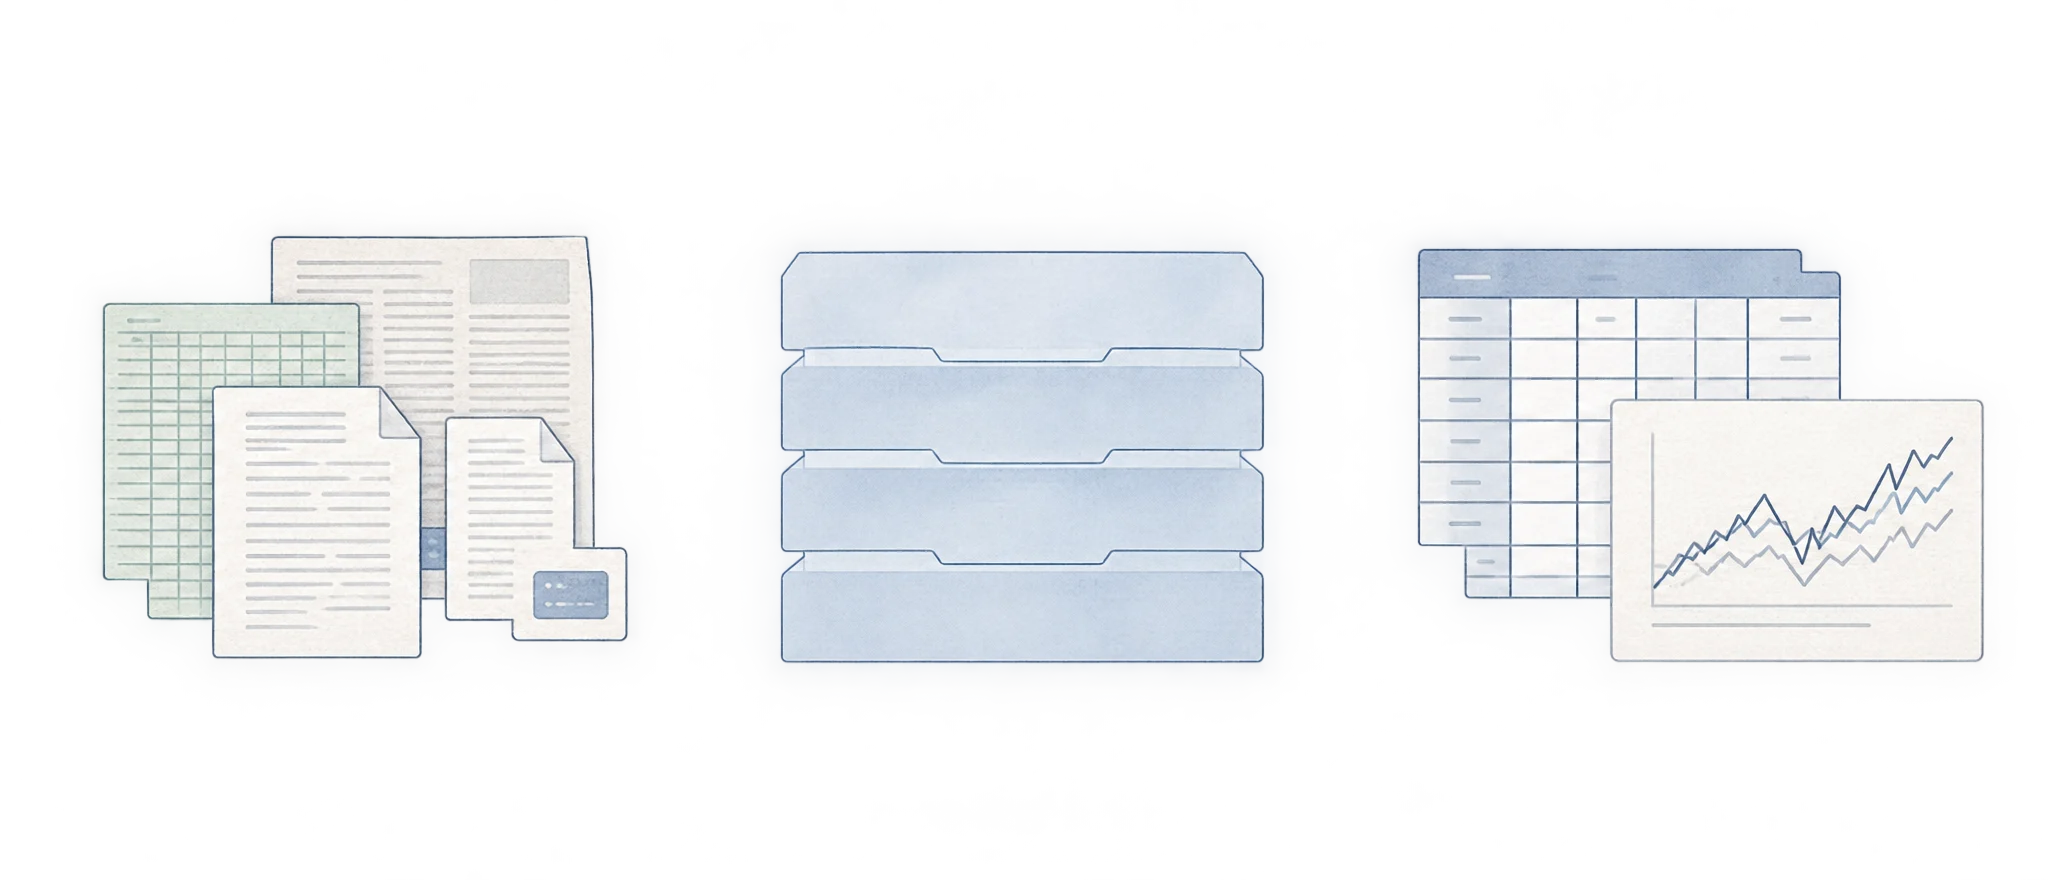
Sources. Scattered, dirty or unstructured data.
Process. AI and economist judgment to organize and interpret.
Information. Information that can be queried, interpreted and sold.
AI processes. Economist judgment interprets.
Data needs context. We combine AI's processing capacity with an economist's judgment to turn data into information that makes sense.
Usable data. Better-informed questions.
Information you can query
Organize what you know, explore your data and interpret what it means.
Explore time series
A common structure lets you read how data changes over time.
Observe relationships
Economic context helps interpret how your data is related.
The result is usable information, including a foundation for a data product you can sell.
Which data do you want to make usable?
Tell us what data you have and what you need to understand. Let's start with your question.